Trend Analysis
Spot patterns before they become problems
Overview
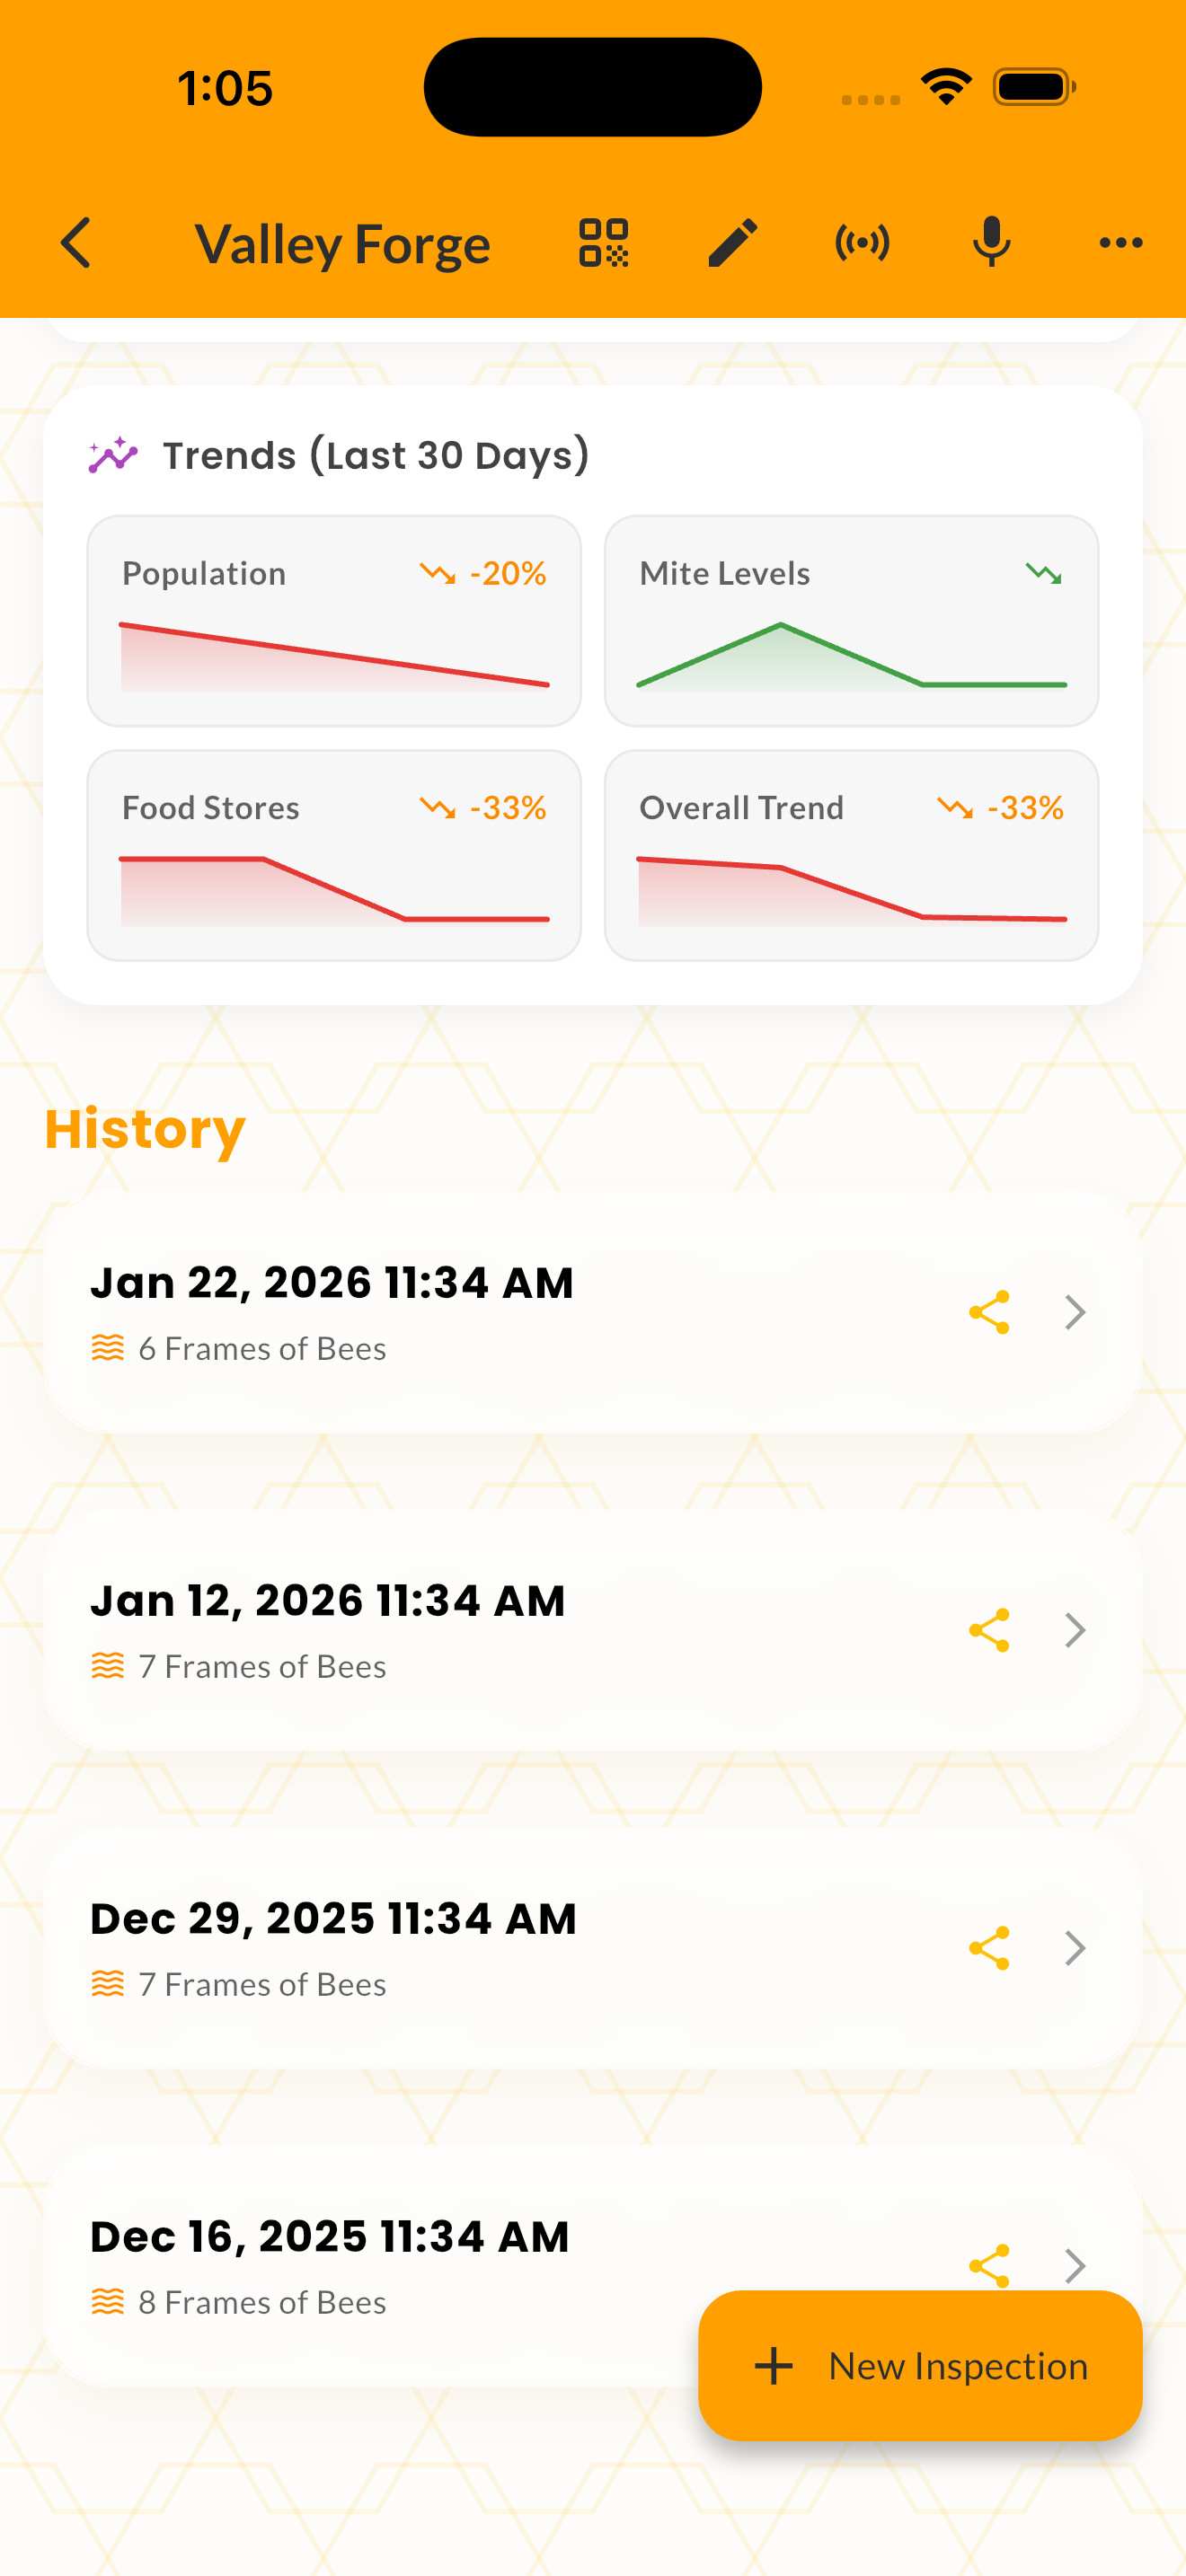
Trend Analysis helps you spot patterns in your hive data before they become problems. The feature uses linear regression across your inspection history to track key metrics — population, varroa pressure, food stores, temperament, and overall health — and shows clear direction arrows for each.
Trends are calculated per-hive from your inspection data. The analysis shows whether each metric is rising, stable, or falling, along with the percentage change and number of data points used.
The trend overview appears automatically on each hive's detail page, giving you an at-a-glance summary of which metrics are heading in the right direction and which need attention.
How It Works
Open any hive to see the Trend Overview card below the Risk Radar.
Review direction arrows for each tracked metric — green rising arrows are good for population, bad for mites.
The system needs at least 3 inspections to calculate meaningful trends.
Log inspections consistently to build a reliable trend picture over time.
Tips & Best Practices
- 💡At least 3 inspections are needed before trends become meaningful.
- 💡Look for seasonal patterns — is your mite spike happening earlier each year?
- 💡Use apiary-wide trends to evaluate the effectiveness of management changes.